Summary
I wrote and published a series of algorithms and optimization studies to help interior designers prepare safe, socially-distanced office space layouts amid the global pandemic.
- Published 3 blog posts on Autodesk sites
- Created reference material for generative design in architecture
- Wrote new functionality for Dynamo
- Helped product team contribute to fighting Covid-19
The Project
The product team for Generative Design in Revit at Autodesk thought they could provide useful tools for designers to find the safest office layout solutions during the pandemic while also showing off their product’s computational power. My job was to do this for them.
Objectives:
- Evangelize the product Generative Design in Revit
- Demonstrate best-in-class script writing with Dynamo
- Help Autodesk make a meaningful contribution to fight the global health crisis
Deliverables:
- Blog posts on an Autodesk site
- Reusable content for Generative Design in Revit
- New functionality for Dynamo
I published three blog posts.
Maximizing Occupancy
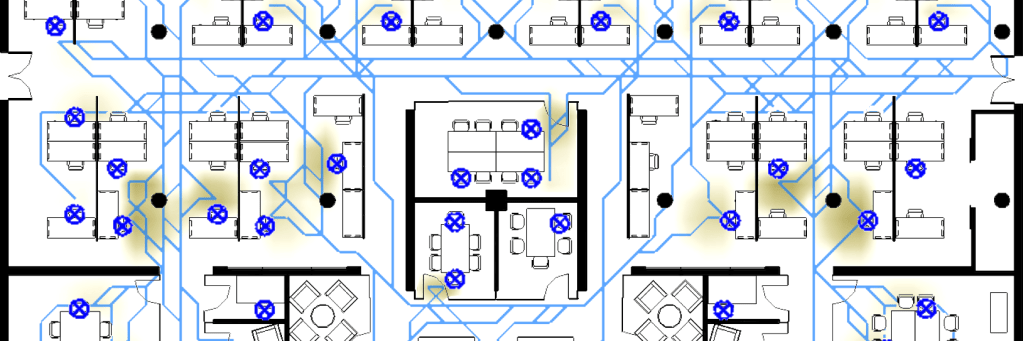
In the first blog post, I demonstrate how to optimize an office layout for social distancing regulation, which at the time required occupants to maintain a minimum separation distance. The algorithm is fast, robust, and its inputs are simple, needing only a separation distance and a Revit model. The post also shows how the Dynamo script can be distributed around an architecture office for use by non-technical Revit users using Dynamo Player.

Spatial Analysis
In the second blog post, the distance optimization algorithm is extended to consider the air flow that would result from people spending their work day in the environment. The idea is to find the safest office layout design, beyond pandemic era legal requirements, to minimize unnecessary interactions and reduce opportunities for transmitting airborne viruses.
To do this, the algorithm uses a spatial analysis package built by Autodesk Research to model how occupants would move around the space throughout the work day.

The spatial analysis module performs many geometric operations of order O(n2) or worse, meaning that the computation time is sensitive to the size of the model. For fast and accurate calculations, it’s sufficient for floor plans to be diagrammatic, like a fire escape plan, where walls are lines and doors are gaps in the lines. At the time of this project, however, there was no way to create a simplified floor plan from a Revit model automatically, which had been a hurdle to all spatial analysis workflows.
To unblock this project, I created new functionality in Dynamo to extract and process geometry from a Revit model via the API, and I developed heuristics to handle special cases.
Once usage patterns are modeled, lots of great metrics can flow from the resulting data. In the blog posts, I show how to use spatial analysis results to identify areas of congestion, and how to score individual seats by their exposure to higher-than-average foot traffic.

Multi-Objective Optimization
The best office layout would have the greatest number of occupied seats, the greatest average separation between occupied seats, and the most disbursed foot traffic. The “perfect” office would therefore be both the densest and sparsest populated, which is impossible.
Multi-objective optimization is about compromise and improving performance. In the blog posts, I show how to use Generative Design in Revit to find the set of best-performing solutions for a designer to choose from. For example, when solutions are plotted as points along axes representing opposing objectives, the best-performing solutions will lie along a curve called the Pareto Front.

To visualize more than three dimensions at once, a designer can use a parallel coordinates chart, where a single solution is represented as a line connecting the values of the input parameters and output metrics that describe it. This visualization technique helps visualize trends such as whether a solution’s performance on a set of output metrics is correlated to any input parameter’s value.

Best Practices
The third blog post describes best practices for writing a large, complex script in Dynamo. Visual scripting languages are powerful tools for non-programmers to express logic, but they lack some of the richer functions that integrated developer environments provide for traditional code writing. This means that special care must be taken to keep scripts efficient and organized.

At the time of this project, the Dynamo product team believed that I had written several of the largest-ever Dynamo scripts, and this was a chance for me to share my distilled learnings after so often pushing the boundaries of the tool.